Web developers, March 12th is the date that Interaction to Next Paint (INP) became a Core Web Vital, replacing First Input Delay (FID). INP and FID both intend to help developers have a measurement for how quickly your site responds to user interaction.
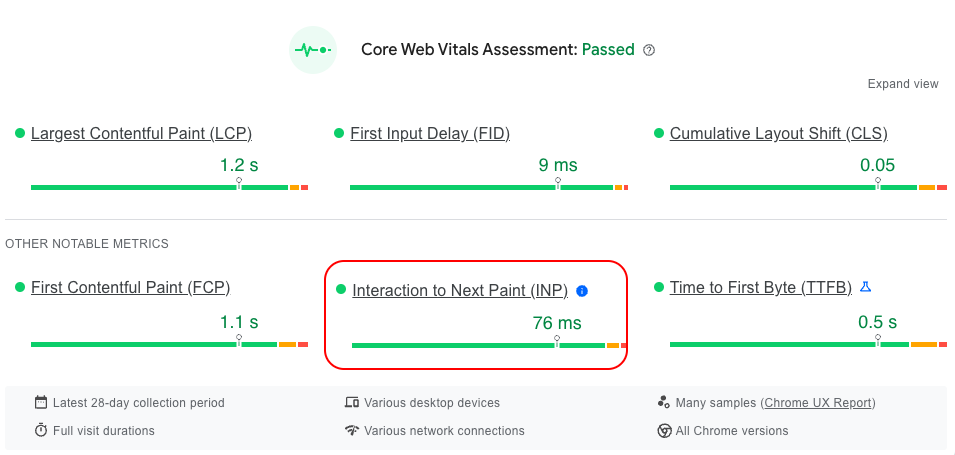
All of the core web vitals are different metrics evaluating the same thing
The Core Web Vitals assess one thing - does your page feel sluggish to visitors? The measurements themselves target things that Google believes have the largest impact on perceived sluggishness.
The raw second/milisecond and visual stability score you get don't change over time, however because what is determined as good/bad is based on a percentile of sites and that data is updated over-time, your score should consistently get worse over time if you do nothing to keep updating your site's performance.
If that doesn't make sense - think of it this way - you're in a race with millions of other people, there is no finish line, there's no getting tired and needing a break. You're all checking your relative speed to each other. Being in the top 25% of racers speed wise is what you all consider as being good. Folks who're far behind start to make improvements to their speed trying to get themselves into that top 25%, many succeed, many make only marginal gains. Folks who're already in that top 25% continue to optimize and tweak to improve little things they're doing to get just a little bit more for every step they take. Because you're all trying to be in that top 25%, over time it becomes harder and harder to achieve because more of the folks who were once slow are now speeding up, and everyone who was fast, keeps making minor speed improvements. The mph/kph that was required to be in the top 25% when you started will be lower than the mph/kph required to be in the top 25% at any time after that.
Why is it a race with no end and moving targets?
The purpose of core web vitals is not about you, it's not about your site, it's about all websites on the internet. It serves as a means to motivate everyone to build websites that don't feel sluggish. As sites start to feel less sluggish, unfortunately the user's expectation of how fast something should feel also shifts. There's no magic "once I get my metrics within this threshold it will feel speedy forever".
What is Interaction to Next Paint and why is it better than First Input Delay?
Interaction to Next Paint as a measurement is an improvement over First Input Delay because instead of measuring just the first interaction it accounts for all interactions, event handlers and delay in presenting the next frame. This is a more wholistic approach to validating that the UI/UX of your site feels consistently fast.
Optimizing for INP is similar but more wholistic than FID.
Examples of things to avoid:
- Rendering large chunks of HTML in response to a user interaction. Instead use css to show/hide large blocks of html instead of creating and removing elements when possible.
- Updating CSS styles using JavaScript in response to user interactions. (ex: applying a css class is faster than applying tons of individual styles using JavaScript.)
- Omitting height and width attributes from images that appear in response to a user's interaction. If you include width and height attributes the browser can perform layout calculations faster.
- Doing a lot in event listener callbacks. Keep it as simple as possible, separate the critical and non-critical responses to user interaction, you can use setTimeout() and optionally requestAnimationFrame() to wrap all of the non-critical code. To decide what's critical, decide what things have to show for a user right away, and what things would be okay to show, calculate, or do slightly later.
A secret weapon requiring some practice
There is something you can do which helps mitigate much of the layout and style related performance issues, but it requires you to understand what you're doing.
I'm referring to the CSS property, content-visibility. The values you can provide are auto, style, layout, and paint. Most of the time auto will be fine. The challenge though is that your CSS for the element you are using this on should:
- Ensure that the element will not need to resize based on any elements inside of it.
- Elements inside this parent element should not affect elements outside of the parent element.
- CSS Styles on child elements should not escape the boundary of the parent element.
If you do it successfully the children of the parent element can be lazily rendered by the browser improving performance. For folks worried about accessibility - this has no impact on assistive technology's ability to see the content. It does not work in the same way as the visibility property in CSS.
While content-visibility is great for website performance overall, it specifically affects INP when your page will make HTML visible in response to a user's interaction.
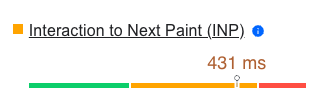
How do you test and diagnose INP issues?
Use Google's Page Speed Insights tool on the web as well as the tool in your browser's developer tools to first determine if you have a poor INP score. If your INP is already good, jumping in and trying to improve it more might border on micro-optimization and not really improve much.
Testing and diagnosing this in the lab (a setting you fully control) is a bit different than diagnosing other performance issues where Google Page Speed Insights for example can outright tell you what the issues are.
You'll need to identify what your core user flows are in your site. For example signing up for a new account, making a purchase, logging in. Then manually test using the Web Vitals Chrome Extension by opening your site, right click the extension, choose options, then enable the box for Console Logging, and hit save.
Now with the console open you can click around on your page and see data that helps you assess how quickly your page is responding to specific interactions. That said the tool doesn't give you much to go on for diagnosing where the root problem is. For that you could use the performance profiler tool in Chrome - just be aware this tool can be a little difficult to get insights out of.
How should you approach solving for INP?
Approach optimizing your site iteratively instead of all in one go. Trying to solve all of the issues at once will cause you to over-engineer, over-refactor or just waste time. INP is going to require more JavaScript focused optimization since most interaction is handled with JavaScript so focus your time there.
Make little changes, measure, collect field data if you can, repeat until you're in the green.
Overall don't fear the change, yes it's something new, yes it requires some technical skills, but I doubt it becoming a search ranking factor will tank a site's rank overnight. Google cares more about the content than how fast it loads. Fast loading garbage is still garbage, where as slow loading quality content is still quality content. I also think we'll start to see JavaScript frameworks doing things to help make it even easier.
Want to learn more about optimizing your site for speed?
Myself, other HubSpot CMS experts, and website performance enthusiasts at HubSpot put together a pretty great guide to speed. It's honestly great for anyone regardless of if you use HubSpot's CMS - because website performance is evaluated the same regardless of what platform you use. That said if you do use HubSpot you'll find some really useful HubSpot specific optimizations you can do as well!